Crosstab query
Crosstab queries are a quick way to check the spread of coding across cases and demographic variables.
For example, you can use crosstab queries to:
-
Check how often interview respondents refer to a particular topic or issue

See below Cross-tabulate codes and cases
-
Compare what different demographic groups have said about a theme
See below Cross-tabulate codes and attributes
You can change the values displayed in crosstab query results, and modify their appearance, in order to extract further information from the data Working with the results of a crosstab query.
Before running a crosstab query, you need to:
- Create cases for the people, places or other entities that are the focus of your analysis Cases
- Define the demographic attributes of the cases Create case classifications
- Code your source material at the cases and codes Coding
Cross-tabulate codes and cases
You can use a crosstab query to check the spread of coding across the cases in a project.
On the Explore tab, in the Queries menu, click Crosstab.

1From Crosstab codes against, choose Cases.
2Add codes to the Codes panel—drag and drop from the List View or click the plus sign.
3Add cases to the Cases panel—drag and drop from the List View or click the plus sign.
4To limit the scope of the query, choose Selected Items or Selected Folders. For example, you could search only the files in your Interviews folder.
5Click Run Query. Click the button down-arrow for the option to automatically save the results.
NOTES
- The column totals indicate the total number of references for each
- The row totals indicate the total number of coding references for each
- Click the Chart tab on the right of the query results to display the results in a chart.
- To save the query criteria (so you can run the query again), click Save Criteria at the top of the crosstab criteria.
- To save the results, click Save Results after running the query. The crosstab results are stored in the Query Results folder under Queries in the Navigation View.
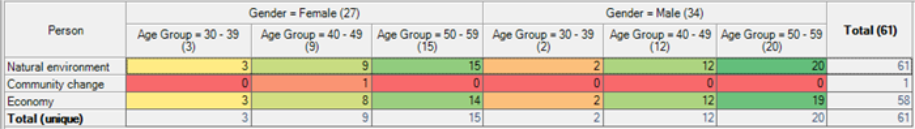
Cross-tabulate codes and attributes
You can cross-tabulate codes against case attribute values.
On the Explore tab, in the Queries menu, click Crosstab.
Then, specify the query criteria:

1From Crosstab codes against, choose Attributes.
2Add codes to the Codes panel—drag and drop from the List View or click the plus sign.
3Choose the classification for the attributes you want to cross-tabulate and choose one or two attributes. Use the arrows to reorder.
4To limit the scope of the query, choose Selected Items or Selected Folders. For example, you could search only the files in your Interviews folder.
5Click Run Query. Click the button down-arrow for the option to automatically save the results.
NOTES
- The column total is the number of unique cases (with selected attributes) that have coding to the themes. This is a useful way to see which group has the most coding across the themes.
- The row total indicates the number of cases that have coding to the theme (out of all the cases represented in the crosstab). This can give you a feel for the dominant themes across the selected population.
-
- To save query settings so you can run a query again later, click Save Criteria. Name the query criteria file and optionally add a description. The file is saved under Queries / Query Criteria in the Navigation View.
- To save query results click Save Results. Name the results file and optionally add a description. The file is saved under Queries / Query Results in the Navigation View.
Working with the results of a crosstab query
Use the ribbon Crosstab tab to change the values in the crosstab results table, and the way they are displayed:
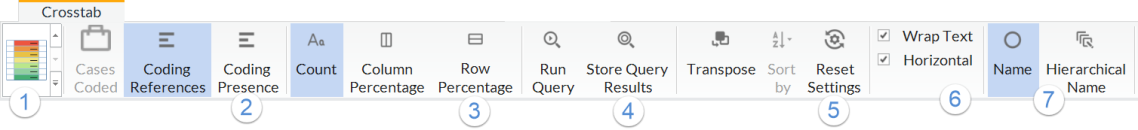
1Apply shading to cells to make it easier to see patterns in the matrix. The colors at the top of the thumbnail are applied to the highest numbers.
2Change the content displayed in the cells.
- Cases/Files Coded Displays the number of cases or files with selected attribute values that are coded to the intersecting code. Use this to answer questions like How many females talked about development?
- Coding References Displays the number of references coded to cases (or files) with selected attribute values and the intersecting code. Use this to answer questions like How often did women mention community?
- Coding Presence Displays whether there is coding to cases (or files) with selected attribute values and the intersecting codes. When you select this, the cells display Yes or No.
3Change the values displayed in the cells between counts and percentages:
- Count Displays a count of the cell content.
- Column Percentage Displays a percentage of the total value of the column.
- Row Percentage Displays a percentage of the total value of the row.
4Run the query, save the results in the Query Results folder.
5Click Transpose to swap the columns and rows or Sort by to order a selected column. Reset Settings returns the table to its original appearance.
6Wrap the text in horizontal column headers. Toggle between horizontal and vertical header text.
7Display column and row header text as simple code or case names, or include the hierarchical location.
Other ways to work with crosstab query results:
- Double-click in a cell to view the coded content.
- To chart the results, click the Chart tab on the right of the Detail View.
- To export the results, on the Share tab, select Export > Export.You can export the crosstab results as a spreadsheet (.csv) or SPSS Data File (.sav).